geometrically speaking
While a was a full-time physics and maths student, i seldom, if ever, thought of proving anything using a diagram, or any kind of non-algebraic method, for that matter. One could make a couple of drawings every now and then to help understanding, but that was all. Not even after learning differential geometry did my view change. As a matter of fact, with the emphasis on (and the beauty of) abstract representations (as in abstract tensor notations), using drawings of surfaces embedded in Euclidean space felt like cheating. To make things even worse, my first serious physics book had been Landau and Lifshitz's Classical Field Theory, where even words are scarce, let alone drawings or diagrammatic reasoning 1. In a nutshell, i would have felt at home reading Lagrange's introduction to his Méchanique Analytic2:
No figures will be found in this work. The methods like i set forth require neither constructions nor geometrical or mechanical arguments, but only algebraic operations, subject to a regular and uniform procedure.
Counting squares
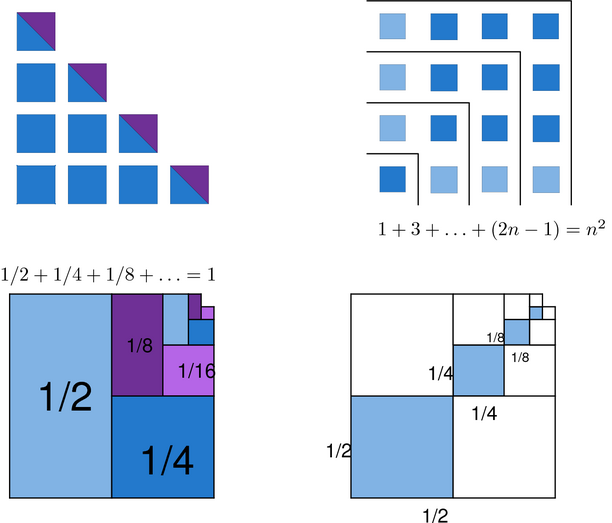
I'm stealing the quote above from a talk entitled Proofs and Pictures3, which started me re-thinking about diagrams in physics (and maths) in the first place. It was given at the Perimeter Institute by James Brown, a professor of Philosophy of Science at the University of Toronto. In this fun talk, professor Brown explores the use of geometrical reasoning in maths and physics as a means of actually proving results. Some simple but instructive (and, to me, somewhat surprising and definitely amusing) examples of such "proving by diagrams" are given in the figure on the left (click to enlarge), which shows how getting general formulas for arithmetic and geometric sums may be as easy as counting squares. I'm giving away just two of them, so that you can try your hand with the other two and have a little fun (you can also try to invent your own, maybe going to 3- or even n-dimensional cubes, in which case, please, don't forget to post your discoveries below! :)). Although elementary, these proofs are intriguing: would you accept them as such? Brown argues that they do, since they can be used to show the validity of the induction step in the usual algebraic proofs. I'm not sure i buy the argument, but it's a very interesting one.
Penguins and lollypops
Turning our attention to physics, probably the most famous diagrams in the field are Feynman's. As i'm sure you know, they offer a convenient notation for manipulating terms in QED's perturbative expansions. Taken at face value, or, one might say, analytically, the represent just algebraic combinations of functions (propagators) entering a power series expansion in a small parameter (the interaction coupling constant, alpha). But they're usually interpreted as providing the actual physical mechanism for the interaction of real particles by means of exchanges of virtual, unobservable photons. Albeit intuitive and appealing, this interpretation has always bothered me. After reading about it in popular science books, i expected QED being somehow based on photon exchanges from scratch. Instead, what one has is a principle of least action which leads to differential equations unsolvable in exact analytical form. Then, when calculating an approximate solution to a scattering problem using a power series, one obtains (the analytical equivalent) of Feynman diagrams and interprets them, so to speak, after the fact. I would somehow feel more comfortable if the process were the other way around: start with the (supposedly) physical underlying process (the photon exchange) and derive the scattering amplitude. Each Feynman diagram would then represent an actually possible scenario, in the same sense that an electron choosing one slit in the two-slit experiment is possible: one can break the superposition and observe the electron in its way through the slit. But this is of course impossible: virtual photons are unobservable, if only because they travel faster than light and violate energy conservation. To add to my uneasiness, a plain Feynman series leads to divergences to be cured, non-diagrammatically, by renormalisation. Yet, everyone since Feynman discusses this spooky photon ping-pong as the right interpretation4, so probably i'm just showing off my lack of understanding! And, besides, one could arguably point to measurable vacuum polarisation effects like Casimir's as an experimental proof of the existence of virtual particles (see for instance this recent, accesible account at PR Focus). Or one could even see the situation as a derivation of the interaction underlying mechanism from first principles, an stunning testament to their power5. At any rate, and specially if one accepts the mainstream interpretation, Feynman diagrams appear as a good example of how diagrammatic tools can be more than just a picture, and not only in mathematics. For more on Feynman diagrams and pointers to further reading, see their WikiPedia entry, or get Diagrammar a CERN report by 't Hooft and Veltman with all the gory details with a deliciously retro (as in written in 1973 using a typewritter) flavour.
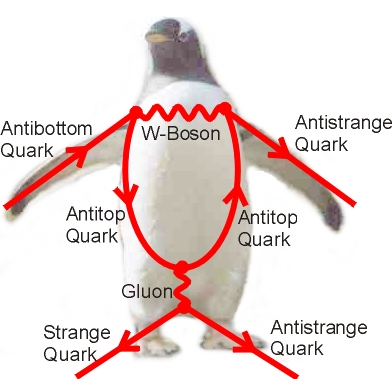
Before leaving the subject of Feynman diagrams, let me mention two bits of diagrammatic folklore stolen from Peter Woit's latest book. Naturally enough, recurring diagrams have got pet names over the years. The first one seems to have been the tadpole (for a diagram shaped, well, like a tadpole), coined by Sidney Coleman and resignedly accepted by the Physical Review editors after he proposed lollypop and spermion as alternatives. The second anecdote involves a diagram (depicted above) known as penguin since Melissa Franklin won a dart match over John Ellis: Tommaso Dorigo has recently recounted the story in his blog.
Tensors and birds
Roger Penrose's thought is all but geometrical, and it comes as no surprise that he has made many a contribution to the physics by drawing camp. Every decent course on General Relativity touches conformal diagrams6, a nifty method envisioned by Penrose and Brandon Carter (back in the sixties) to bring infinity back into your drawing board. The trick consists on scaling your metric by a global function that vanishes quickly enough when your original coordinates go to infinite. Such scaling is known as a conformal transformation, and has the virtue of preserving angles; in particular, null geodesics are mapped into null geodesics and, therefore, the causal structure (represented by null cones) is untouched. While beautiful and handy, i think that conformal diagrams do not add anything really new from a computational standpoint (as Feynman diagrams do), let alone serving as the basis for actual proofs.
More interesting for our current musings is Penrose's graphical tensor notation. Tensor indexes (specially in its abstract flavour, also introduced by Penrose) are a quite convenient housekeeping device, ensuring almost automatically the consistency of your equations and even (once one has a bit of practice with them) suggesting their form7. But, convenient as they are, indexes seem to be confusing for geometrical minds like Penrose's, who some fifty years ago devised a pictorial representation for tensor equations8.
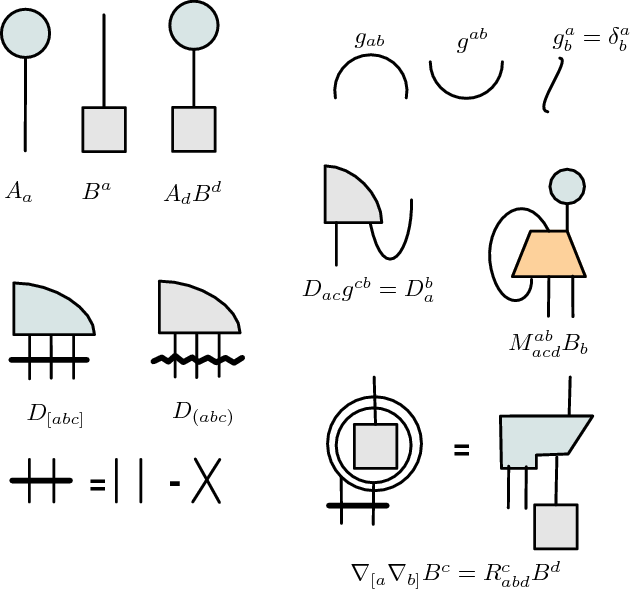
As you can see in the figure, the idea is simple: choose a closed polygon to represent the kernel letter of each tensor, and add an upwards leg for each contravariant index, and a downwards one for each covariant index. Index contraction is represented by joining the respective legs. A wiggly horizontal line represents symmetrisation; a straight one anti-symmetrisation. One can cross legs to indicate index shuffling. The metric gets no kernel figure (it's just an arch), so that contractions of indexes in the same tensor are easily depicted, and raising and lowering indexes amounts to twist the requisite leg up or down. To indicate covariant differentiation, circle the tensor being differentiated and add the corresponding downwards (covariant) leg. And so on and so forth. Note also that commutative and associative laws of tensor multiplication allow your using any two dimensional arrangement of symbols that fits you, which aids in compactifying expressions. Penrose explains the many details and twists of the notation in The Road to Reality and in his (and Rindler's) Spinors and Space-time I, where you'll find extensions to deal graphically also with spinors and twistors. According to the latter,
The notation has been found very useful in practice as it greatly simplifies the appearance of complicated tensor or spinor equations, the various interrelations expressed being discernable at a glance. Unfortunately the notation seems to be of value mainly for private calculations because it cannot be printed in the normal way.
Besides the (not so obvious nowadays) difficulty mentioned above, i guess that the main hurdle in adopting Penrose's notation is habit. After many years using indexes, my algebraic mind seldom finds equations confusing because of their indexes. But after a little practice it becomes easier, and i'd say that people who see equations will find it quite natural after a very little while9. I don't know how popular Penrose graphics are among physicists for private use, but there's many an example of their application and extension to related fields. A few years after its introduction, the notation was rediscovered by Pedrag Cvitanovic, who used a variation of it in an article on group theory and Feynman diagrams. More concretely, Cvitanovic uses diagrams similar to Penrose's to represent to represent the structure constants of simple groups in the context of non-abelian gauge theories, interestingly linking them with Feynman diagrams (and closing a loop in this article!). Later on, he would use the notation very extensively in his on-line book on Group Theory, where the diagrams go by the name of bird-tracks. In a nutshell, the book is devoted to answer, in Cvitanovic words, a simple question:
"On planet Z, mesons consist of quarks and antiquarks, but baryons contain 3 quarks in a symmetric color combination. What is the color group?" If you find the particle physics jargon distracting, here is another way to posing the same question: "Classical Lie groups preserve bilinear vector norms. What Lie groups preserve trilinear, quadrilinear, and higher order invariants?"
From here, an amazing journey through the theory of Lie groups and algebras ensues, a journey conducted almost exclusively by diagrams. For, notably, Cvitanovic uses his bird-tracks (as mentioned, a very evolved kind of Feynman diagrams) to actually derive his results. We have here physics (and maths) by diagrams for real, actually replacing algebraic reasoning (and, incidentally, a proof that Penrose's reservations about his notation not being apt for publications are unfounded nowadays–i wonder how Cvitanovic draws his diagrams).
Before leaving the subject, let me mention a couple more works inspired by Penrose's diagrammatic notation. Yves Lafont has greatly extended it and carefully analysed its application to mathematical problems in the context of category theory and term rewriting systems. If you're privy in the field, or simply curious, take a look at his articles Algebra and Geometry of Rewriting (PS) and Equational Reasoning With 2-Dimensional Diagrams , where Yves explores two-dimensional diagrams a la Penrose with an eye to (possibly automatic and computer-aided) derivations much in the spirit of Cvitanovic. And, turning back to physics, if there's a theory prone to diagrammatic reasoning it must be Loop Quantum Gravity, where the basic constituents are graphs and their transformations. Arguably, LQG is the most fundamental example discussed so far of graphical reasoning applied to physics, for here graphs (and their combinations in spin foams, an evolution of another Penrose invention, spin networks) do stand for themselves, as opposed to representing some underlying algebraic mathematical entity. Wandering into the marvels of LQG would carry us too far afield, so i'll just point out that Rovelli, Smolin and friends use not only Penrose's spin networks, but, on occasion, also the graphical tensor notation we've been reviewing; see for instance their seminal paper Spin Networks and Quantum Gravity, where Rovelli and Smolin presented their famous derivation of exact solutions to the Wheeler-DeWitt equation. The notable thing is, again, the fact that graphic notation is key in many a derivation, and cannot be seen as just an aid to represent some calculations.
Kindergarten categories
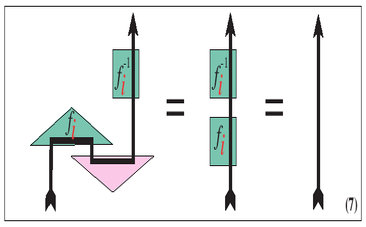
Our final example of physics by diagrams comes from the category theory-inspired view of Quantum Mechanics invented by Samsom Abramsky, who has managed to do "quantum mechanics using only pictures of lines, squares, triangles and diamonds". This beautiful notation (or picture language, as their authors call it) is nicely explained in Bob Coecke's Kindergarten Quantum Mechanics, a very pedagogical set of lecture notes where it is applied to the problem of quantum teleportation. Bob's thesis is that teleportation was not discovered until the 90's (despite it's being a relatively straightforward result in QM) due to the inadequacy of the commonly used, low-level mathematical language used to describe Hilbert spaces. Had lines, squares, triangles and diamonds been used from the beginning, teleportation would have followed almost immediately. Or so thinks Bob: go take a look at his article and see what's your take. In any case, its more than sixty full-color diagrams, used instead of boring algebraic formulae, make for a fun reading (or, should i say, viewing). By the way, don't let the mention to category theory put you off: only very basic ideas (explained in the lecture notes) are needed, if at all, in this case, and actually the author's enthusiasm goes as far as making the bold claim that this new graphical formalism could be taught in kindergarten! Maybe that's the gist, since i, for one, find the notation hard to follow, undoubtedly due to my old-school, algebraic upbringing. Just to give you an idea of how this preschool notation looks like and close this long post as it deserves (i.e., with a diagram), here you have how the teleportation protocol (including a correctness proof) looks like:
Footnotes:
My copy (Spanish translation) of the fifth edition of L&L's book has 500 pages and just 22 figures!
The link above points to Volume 11 of the collection at Oeuvres de Lagrange, a site that contains what seems to be the complete Lagrange corpus, conveniently scanned and downloadable too.
I would give you a direct link, did it exist. Unfortunately, PI's website is not up to the quality of their other activities. You'll find it by browsing to their Public Lectures Series and from there to page 2 (or search for James Brown). Another very unfortunate circumstance is that the videos are only available for those of you not/ using weird as in freedom operating systems :-(.
That's at least my impression. Penrose, for instance, advocates for their reality in his road. The subject is however controversial enough to grant the existence of monographs like the recent Drawing theories apart, by David Kaiser (which i cannot comment on since i've just added it to my wish list).
But i find this argument hard to swallow. Think for instance in the interpretation of antiparticles as particles travelling backwards in time: it also follows naturally (for some definition of natural) from perturbative series and/or their diagrams, but it is not as easily accepted as the existence of virtual photons. One wonders, where's the limit?
If you haven't your favourite textbook at hand (Hawking and Ellis being mine when it comes to anything related to causal structure), you can find a pretty good introduction on-line in this chapter of Sean Carroll's lecture notes.
There is only so many ways of combining indexes, and if you know what are the free ones on, say, your LHS and the tensors entering the RHS and its general properties (e.g. symmetries), it's often an easy task how their indexes should be combined. It reminds me, in a way, of dimensional reasoning, where knowing the target units and the ingredients gives an often quite accurate clue of how to combine them.
It was introduced in a chapter of the book Combinatorial Mathematics and its Applications (Academic Press, London, 1971), entitled Application of Negative Dimensional Tensors. But Penrose have been using it (according to this letter to Cvitanovic (PDF) since 1952.
An interesting (and not too far fetched) software project would be to write a Penrose diagram editor, possibly with support for tablet input devices. Such a tool would also probably solve the publication issue. In an ideal world, one would use a stylus to draw equations which would get automatically imported as nice diagrams, regular tensor equations with indexes or both. Any takers? ;-)
